Two-Phase Flow in Porous Media
| Capillarity is the driving force that plays an important role in the displacement of one fluid by another at the microscale on a solid wall. Understanding and quantifying capillary forces is crucial in designing products and applications that deal with immiscible fluids. In context of fluid transport in fibrous materials, the rate of fluid absorption is often predicted using the Lucas–Washburn (LW) equation. Typical LW models are developed on the basis of treating a porous medium as bundles of 1-D parallel capillary tubes with a given single-value contact angle. A more accurate (but more rigorous), model for fluid transport is the Richards equation, which requires mathematical relationships for the capillary pressure pc=pc(S) and relative permeability K(S) of the porous media as a function of its instantaneous fluid saturation. |
 Richards equation can be solved numerically to predict fluid saturation as a function of time and space S=S(x,y,z,t) in a fluid absorbing (or fluid releasing) porous material. Instantaneous saturation is needed to predict the rate of fluid absorption into (or release from) the material [Jaganathan et al., 2009]. Richards equation can be solved numerically to predict fluid saturation as a function of time and space S=S(x,y,z,t) in a fluid absorbing (or fluid releasing) porous material. Instantaneous saturation is needed to predict the rate of fluid absorption into (or release from) the material [Jaganathan et al., 2009]. |
| Capillary pressure is the pressure required to force a nonwetting fluid into a porous media (e.g., forcing air into a hydrophilic media initially filled with water) as can be seen in the figure below. |
 2-D numerical simulation of water drainage from a fibrous media comprised of fibers with different degrees of hydrophilicity. The red and black fibers have a Young-Laplace contact angle (YLCA) of 65 and 35 degrees, respectively. It can be seen that fluid saturation percentage decreases (from left to right) by increasing the intrusion (capillary) pressure [Bucher and Tafreshi 2014]. 2-D numerical simulation of water drainage from a fibrous media comprised of fibers with different degrees of hydrophilicity. The red and black fibers have a Young-Laplace contact angle (YLCA) of 65 and 35 degrees, respectively. It can be seen that fluid saturation percentage decreases (from left to right) by increasing the intrusion (capillary) pressure [Bucher and Tafreshi 2014]. |
| Such simulations can be used to produce a mathematical relationship between capillary pressure and fluid saturation in single- or multi-component (comprised of fibers with different fiber diameter of contact angles) as can be seen in the figure below. |
 Effects of reducing the mass fraction of hydrophilic fibers (from A to E) on capillary pressure of bicomponent media comprised of hydrophilic (black) and relatively hydrophobic (red) fibers. All media have the same porosity and fiber diameters and are under the same intrusion pressure of 7 kPa [Bucher and Tafreshi 2014]. Effects of reducing the mass fraction of hydrophilic fibers (from A to E) on capillary pressure of bicomponent media comprised of hydrophilic (black) and relatively hydrophobic (red) fibers. All media have the same porosity and fiber diameters and are under the same intrusion pressure of 7 kPa [Bucher and Tafreshi 2014]. |
|
A fast and flexible method to estimate the capillary pressure of a 3-D fibrous media is the Pore Morphology Method (PMM). PMM employs a voxel-based approach to present a quasi-static description of how a non-wetting phase penetrates into a porous medium filled with a wetting phase. PMM simulations are faster than the convention methods (e.g., the Volume-of-Fluid or Lattice Boltzmann method) by orders of magnitude as the PMM simulations are merely geometry-based calculations (i.e., do not require solving the Navier–Stokes equations). The PMM approach can make 3-D two-phase flow simulations computationally affordable for industrial applications. PMM relies on two primary morphological operations, referred to as dilation and erosion, to simulate the spatial distribution of the phases in response to an increase in the non-wetting phase pressure. The pictures below show example results obtained from our in-house PMM computer code [Gautam et al. 2025]. |
 Our MATLAB implementation of the PMM algorithm is demonstrated a 2-D periodic domain comprised of nonspherical solid objects (a). The dilation process is shown in (b) and (c). The no-wetting phase voxels isolated from their reservoir are turned into wetted voxels in (d). The erosion process is shown in (e). The final result is shown in (f) for the given intrusion pressure [Gautam et al., 2025]. |
| The PMM algorithm was then used in larger geometries to conduct realistic simulations of fluid saturation/desaturation in 2-D fibrous media as shown the figure below. |
 Simulation of pressurized air intruding into a fully-wetted fibrous media is shown. The fibers have two different diameters of 10 µm and 20 µm and two different Young-Laplace contact angles of 20 and 60 degrees. The bottom figure is from the semi-numerical simulations of Bucher and Tafreshi (2014) and the top figure is the PMM simulation results generated using MATLAB [Gautam et al., 2025]. |
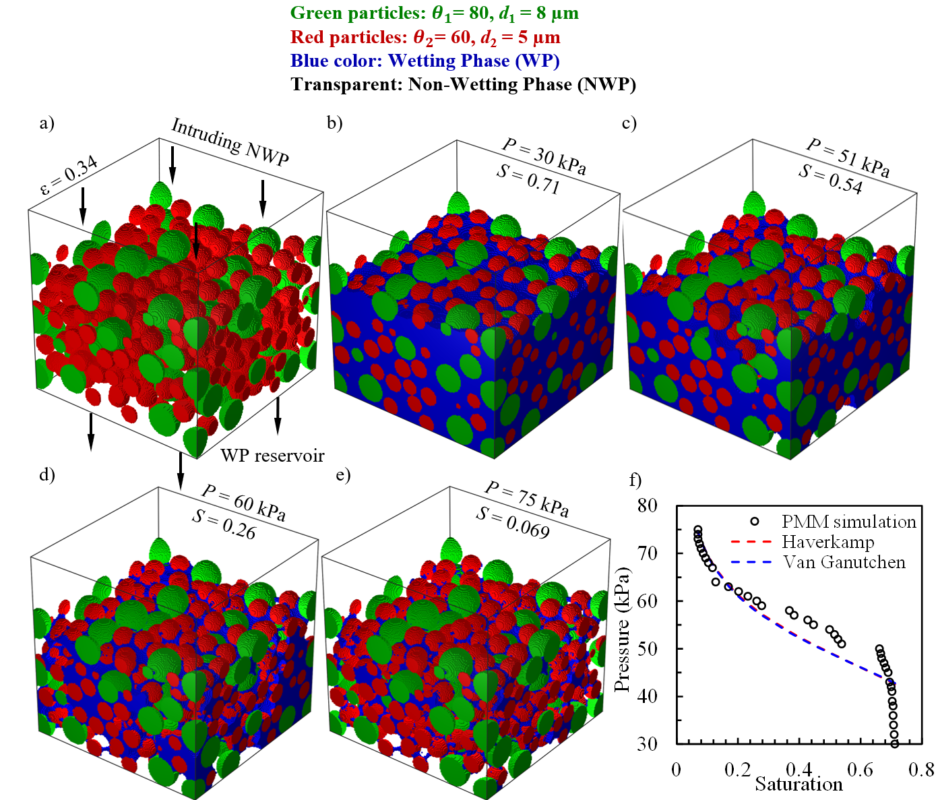
| Our ongoing effort is now focused on extending the above algorithm to the case of 3-D geometries. The figures below show our preliminary PMM simulations in 3-D. |
|
The figure above shows preliminary results for the MATLAB implementation of the PMM algorithm in a 3-D packed bed [Gautam et al. 2024]. |
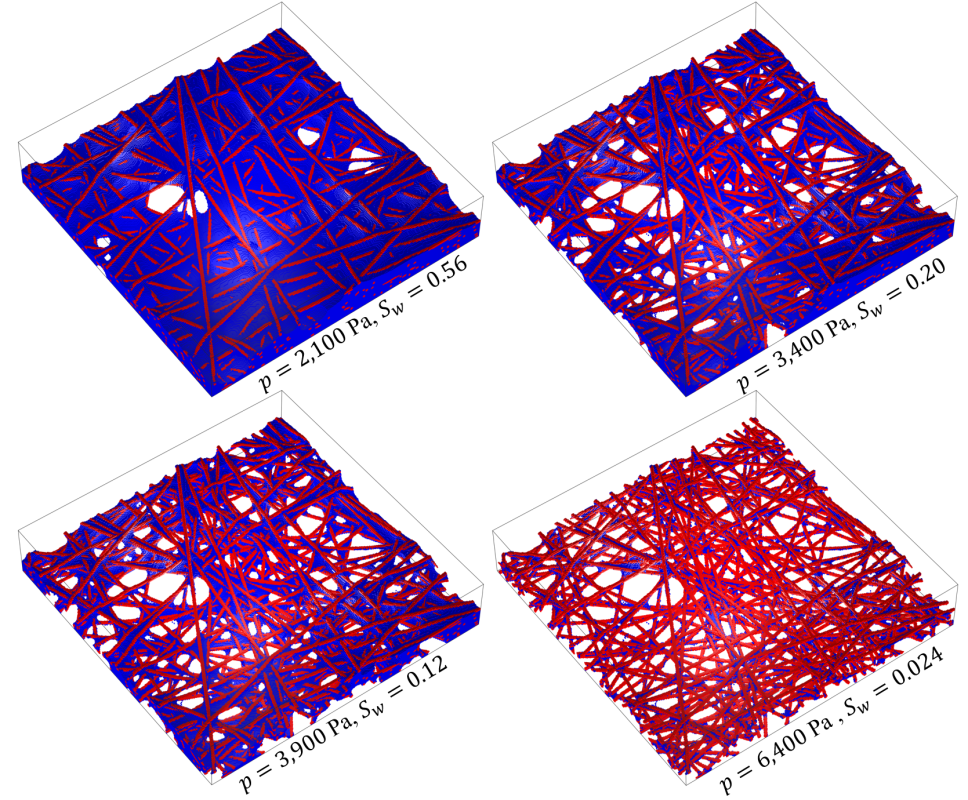
| Preliminary PMM simulation results are shown below for desaturation of a 3-D fibrous medium comprised of fibers with a diameter of 20 µm and an YLCA of 10 degrees. The wetting phase here is water (shown in blue). |
|
The figure above shows preliminary results for the MATLAB implementation of the PMM algorithm in a 3-D fibrous domain [Bhatta et al. 2024] |
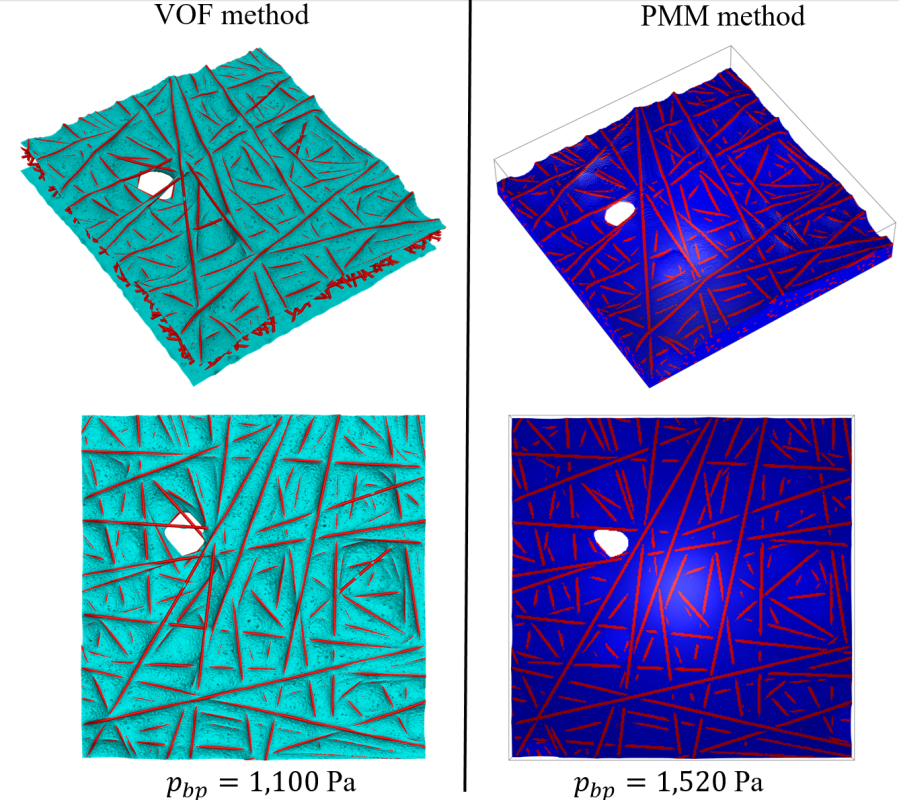
| The PMM simulation results show good qualitative agreement with those obtained via VOF method as shown below. |
|
The figure compares the VOF and PMM simulations of bubble point formation in a 3-D fibrous domain [Bhatta et al. 2024] |
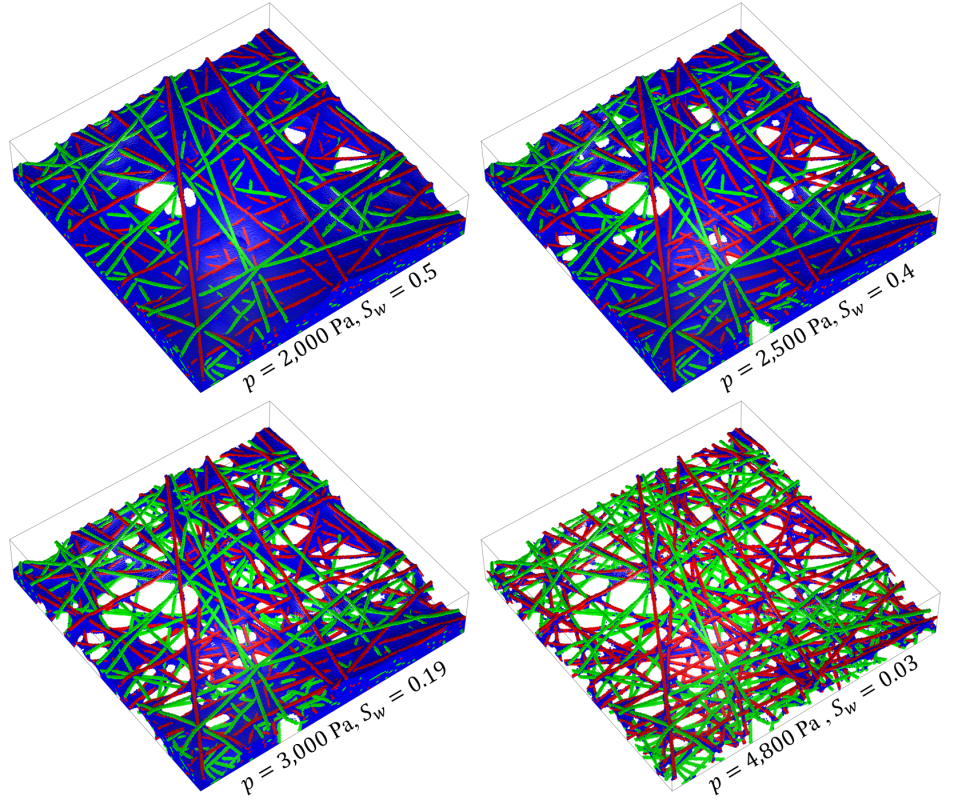
| The PMM simulations can also handle fluid penetration in media with heterogenous YLCAs and fiber diameter. The picture below is an example of such calculations. |
 The YLCA for the red and green fibers is 10 and 80 degrees, respectively. Fiber diameter is 20µm [Bhatta et al. 2024]. The YLCA for the red and green fibers is 10 and 80 degrees, respectively. Fiber diameter is 20µm [Bhatta et al. 2024]. |
| Despite the advances in computational methods, capillary pressure-saturation relationship for media comprised of fluid-storing swelling-contracting porous fibers (e.g., Rayon or cotton fibers) can only be found experimentally. Figure below shows an example of such an experiment [Jaganathan et al., 2009]. |
 Fluid height rise experiment is conducted to obtain a capillary pressure-saturation relationship for nonwoven fabrics made of Rayon (swelling) fibers [Ashari et al., 2010]. Fluid height rise experiment is conducted to obtain a capillary pressure-saturation relationship for nonwoven fabrics made of Rayon (swelling) fibers [Ashari et al., 2010]. |
| Relative permeability is the inverse of the resistance that a partially-wetted media shows against fluid flow. The relative permeability tensor can be obtained by solving the Stokes equations numerically at each saturation levels and post processing the resulting data using Darcy’s law. It is important to note that relative permeability (unlike capillary pressure) is a tensorial property. This means that fluid absorption in the x,y and z directions can be quite different in a fibrous media dependent on the x,y, and z orientation of the fibers. This also means that fibrous media with different overall fiber orientations (but identical solid volume fractions and fiber diameters) can absorb (or release) fluids at different rates [Jaganathan et al. 2008]. |
  Relative permeability tensor can be obtained by solving the Stokes equations for flow of a wetting fluid in a fibrous media under different saturation levels. Figure to the right is an example of relative permeability calculation performed for the 2-D macroscale simulations shown in the next figure below [Ashari et al. 2010]. |
| With relative permeability and capillary pressure obtained from the above 3-D microscale (fiber-level) simulations in terms of wetting saturation, we solved the Richards equation on macroscale (scales comparable with dimesions of the media) using a finite element PDE solver [Jaganathan et al., 2009]. Figures below show an example of such dual-scale calculations conducted for fluid absorption in fibrous sheets with identical parameters but different in-plane fiber orientations. |
 Contour plots of saturation at t = 0.41 s planar media with different in-plane fiber orientations. Different colors from red to blue represent different saturation values from one to zero, respectively. Coordinates are normalized by the actual sample dimensions. The volume of the absorbed liquid in these media is plotted versus time. The figure to the left shows that the rate of fluid spread increases with increasing the in-plane alignment of the fibers. [Ashari et al. 2010]. Contour plots of saturation at t = 0.41 s planar media with different in-plane fiber orientations. Different colors from red to blue represent different saturation values from one to zero, respectively. Coordinates are normalized by the actual sample dimensions. The volume of the absorbed liquid in these media is plotted versus time. The figure to the left shows that the rate of fluid spread increases with increasing the in-plane alignment of the fibers. [Ashari et al. 2010]. |
| We also used our dual-scale modeling approach to simulate the rate of fluid release from moving partially saturated nonwoven sheets in contact with a solid surface. This is a challenging task as the release rate depends on many parameters, some of which are difficult to quantify. In this concern, we developed a diffusion-controlled boundary treatment to simulate fluid release from partially saturated porous materials onto surfaces with different hydrophilicity. Our numerical simulations were accompanied with experimental data obtained for lotion-saturated Rayon and PEY nonwoven wipes using a custom-made test rig. |
 The figure on the left is a schematic illustration of our experimental rig built to test nonwoven wet wipes. The figure on the right compares wipes’ average saturation obtained from our simulations with those obtained experimentally for Rayon wipes at at different speeds [Ashari et al., 2011]. The figure on the left is a schematic illustration of our experimental rig built to test nonwoven wet wipes. The figure on the right compares wipes’ average saturation obtained from our simulations with those obtained experimentally for Rayon wipes at at different speeds [Ashari et al., 2011]. |
Representative Publications:
|
Acknowledgement:
|


